
AI Marketing Analytics Tools Compared: Pricing, Attribution and Setup
Updated · 15 min read · Official-source research
Editorial note: Some links in this article are affiliate links — we may earn a commission if you sign up, at no extra cost to you. Research guides are distinguished from documented firsthand reviews in our editorial standards. Read our editorial standards →

The right marketing analytics tool depends on the decision you need to make. A website owner asking which campaigns bring visitors has a different problem from a SaaS team investigating activation, or a retailer deciding whether advertising creates additional sales. Buying an AI assistant does not make those measurement problems interchangeable.
This guide separates web analytics, CRM reporting, product analytics, attribution and data infrastructure. It gives practical shortlists, current buying information and a setup plan. Prices and documentation were checked on October 31, 2026; amounts are in USD unless stated otherwise. Feature descriptions are vendor-documented capabilities, not measured performance results.
Evidence note: we did not install these products on a test site, measure prediction accuracy or run a hands-on comparison. We have removed the earlier unsupported ROI percentages and unnamed customer success stories. The cost example below is hypothetical and its arithmetic is supplied separately for checking.
Quick picks: choose the measurement job first
| Your main question | Starting shortlist | Why it fits | Main limitation |
|---|---|---|---|
| Which sources bring website visitors and key actions? | Google Analytics 4 | Web/app measurement and acquisition reporting | Predictive metrics require eligibility; traffic alone is not enough. |
| Which marketing interactions connect to CRM contacts and deals? | HubSpot | Marketing and CRM reporting in one environment | Report types, seats, contacts and pricing arrangements need checking. |
| Where do users fail to activate or return? | Mixpanel or Amplitude | Event-based funnels, cohorts and behavioural analysis | Campaign attribution needs an explicit implementation, not just product events. |
| How do complex customer journeys vary by segment? | Adobe Analytics / relevant Adobe CX Analytics product | Enterprise analysis and configurable reporting | Obtain a product-specific quote and implementation scope. |
| Where are visitors getting stuck? | Microsoft Clarity | Session replay, heatmaps and AI summaries | It is not a replacement for a financial or causal measurement system. |
| Did advertising cause additional sales? | Lift tests and, where suitable, attribution/MMM specialists | Methods designed around marketing measurement questions | Access, experiment design and sufficient data remain important. |
These are use-case picks, not a universal ranking. Mixpanel and Amplitude have broadened their offerings, including web and marketing capabilities, but remain relevant primarily to event-based behavioural analysis. Do not dismiss them as incapable of marketing reporting; equally, do not assume that adding their SDK reconstructs every advertising touchpoint.
Compare pricing, AI capabilities and attribution scope
| Platform | Public starting point and free limits | Named AI or automated capability | Attribution and data sources | Setup burden: editorial assessment |
|---|---|---|---|---|
| GA4 | Standard Analytics is available without a software licence charge; Analytics 360 is separate | Analytics Insights and eligible predictive metrics | Web/app events; linked advertising integrations; attribution reports | Moderate: event, consent and revenue validation still required. |
| HubSpot Marketing Hub | Standard product catalogue: Starter from $20/month per Core Seat; Professional from $890/month, including three Core Seats; Enterprise from $3,600/month billed annually | Breeze capabilities vary with product and entitlement | CRM contacts, marketing interactions and connected systems; attribution reports vary by tier | Moderate to high: CRM associations and lifecycle definitions matter. |
| Mixpanel | Free: up to 1 million events/month; Growth includes the first million, with further volume priced separately | Mixpanel Agent and MCP access listed on the pricing page | Instrumented events, profiles and connected data; verify the acquisition model you need | Moderate: design events and identity rules before comparing funnels. |
| Amplitude | Current Free offer: 2 million events/month; Plus starts at $0, with its first 2 million monthly events free and additional usage priced by volume | AI Agents and MCP listed in current plans | Behavioural events plus web/marketing analysis offerings | Moderate: distinguish event-volume plans from legacy MTU pricing. |
| Adobe | Product-specific quote; no verified universal $100,000/year starting price | Adobe Analytics contribution analysis investigates contributors to anomalies | Configured digital/customer-experience datasets; scope depends on the product | High for a new enterprise deployment; obtain a scoped implementation plan. |
Pricing sources: Google Analytics, HubSpot catalogue, Mixpanel pricing, Amplitude pricing, Adobe pricing. Setup assessments describe the likely work involved, not timed product tests.
HubSpot's standard Professional catalogue also lists $3,000 required one-time onboarding. Marketing contacts and extra seats can change the bill. Separately, HubSpot publishes a flexible seats-and-credits supplement with euro-denominated terms. Those are different commercial arrangements: do not convert the supplement into an invented universal dollar price or assume every buyer receives the same offer. Confirm the applicable catalogue, region, commitment and credits in the order form. Flexible pricing supplement
The former Mixpanel “20 million free events” claim confused a paid plan's supported volume with its included allowance. Likewise, a historical Amplitude Plus starting figure should not override today's event-volume page. Current subscribers may have legacy terms. A free allowance also does not establish that every AI feature, replay entitlement or additional product is unlimited.
What each main platform is useful for
GA4: start with reliable events, not predictive audiences
GA4's automated insights can identify unusual changes or emerging trends. That makes it useful for deciding where to investigate, rather than automatically proving why a metric moved. A tagging change can look like a behavioural change; check collection before acting. Analytics Insights documentation
Predictive metrics have substantially higher requirements. Google's documentation requires, within the last 28 days over a seven-day period, at least 1,000 returning users who meet the relevant predictive condition and 1,000 who do not, along with sustained model quality. Purchase-related metrics require supported purchase events, and purchase reporting needs value and currency. A small website can use ordinary GA4 reports without qualifying for these predictions. Waiting three months does not substitute for those conditions. Predictive metrics requirements
Choose it for: a practical starting point for web/app acquisition and key-action reporting. Check before relying on it: consent behaviour, duplicate purchases, time zones, key-event definitions and whether the metric is observed or modelled.
HubSpot: useful when the CRM connection is the point
A B2B team may need to follow marketing interactions through contact creation and sales activity rather than stop at a website submission. HubSpot's attribution documentation distinguishes Contact Create, Deal Create and Deal Revenue attribution. The checked documentation reserves the latter two for Marketing Hub Enterprise accounts. Therefore, Professional must not be recommended as though it includes every revenue-attribution report. Attribution documentation
Choose it for: a team already organising marketing and CRM processes together. Check before buying: the exact report entitlement, deal associations, lifecycle conventions and which AI functions consume credits. An attractive lead score is not proof that a lead will become a profitable customer. Keep a route for sales teams to correct bad classifications.
Mixpanel and Amplitude: connect acquisition to product behaviour
Funnels and retention analysis help investigate questions such as whether sign-ups reach activation and whether activated users return. Mixpanel's current AI offering describes product intelligence, while Amplitude also markets web analytics alongside its product capabilities. Evaluate a specific question against the events and permissions available in the account. Mixpanel AI, Amplitude AI, Amplitude web analytics
Choose them for: growth or product teams analysing behaviour after acquisition. Check before buying: identity merging, anonymous-to-known transitions, event definitions, acquisition properties and retention settings. Natural-language queries can make analysis easier to request, but a plausible answer can still use the wrong conversion event or denominator. Inspect the underlying chart and filters.
Adobe: establish which product and analysis you need
Adobe's current pricing destination covers multiple CX Analytics products. Treat an Adobe Analytics implementation and a Customer Journey Analytics proposal as distinct scopes. A single “Sensei AI” label is not a sufficient buying specification.
Adobe documents contribution analysis as a machine-learning process for investigating contributors to an observed anomaly. That is useful investigative support, but a contributor is not automatically a causal explanation. Choose Adobe for an enterprise requirement that justifies its data and implementation work; check report availability, governance, licences, integration ownership and the actual delivery proposal. Contribution analysis documentation
Attribution is not the same as incrementality
Attribution allocates conversion credit to observed or modelled interactions. Last-click assigns credit to the final qualifying touchpoint under the chosen model. It is easy to communicate, but can underrepresent earlier discovery. Data-driven attribution uses an algorithm to distribute credit. Neither method reveals a complete, perfectly observed customer journey. Google's documentation explains the available attribution models and how credit is assigned. GA4 attribution
Imagine a customer sees a social ad, later searches for the brand, then buys. The channel credited depends on the model, lookback settings and captured signals. If the social impression was not observed, the report cannot treat that missing interaction as a directly measured fact. This is an illustrative journey, not a customer case study or evidence that one channel outperforms another.
Incrementality asks a different question: how many outcomes occurred because of an intervention compared with an appropriate control? Google Ads documents Conversion Lift for measuring incremental conversions. Meta also provides official training on Conversion Lift. Availability and a credible experiment design must be checked; an ordinary before/after comparison is vulnerable to seasonality and other changes. Google Conversion Lift, Meta training
Marketing mix modelling (MMM) uses aggregated data to estimate relationships between marketing inputs and outcomes, with assumptions and uncertainty. It can support strategic budget questions when individual journeys are incomplete, but it is not a shortcut around weak data. Google's open-source Meridian is one documented MMM framework. Its availability does not mean a small site can produce a dependable model after a few weeks. Meridian documentation
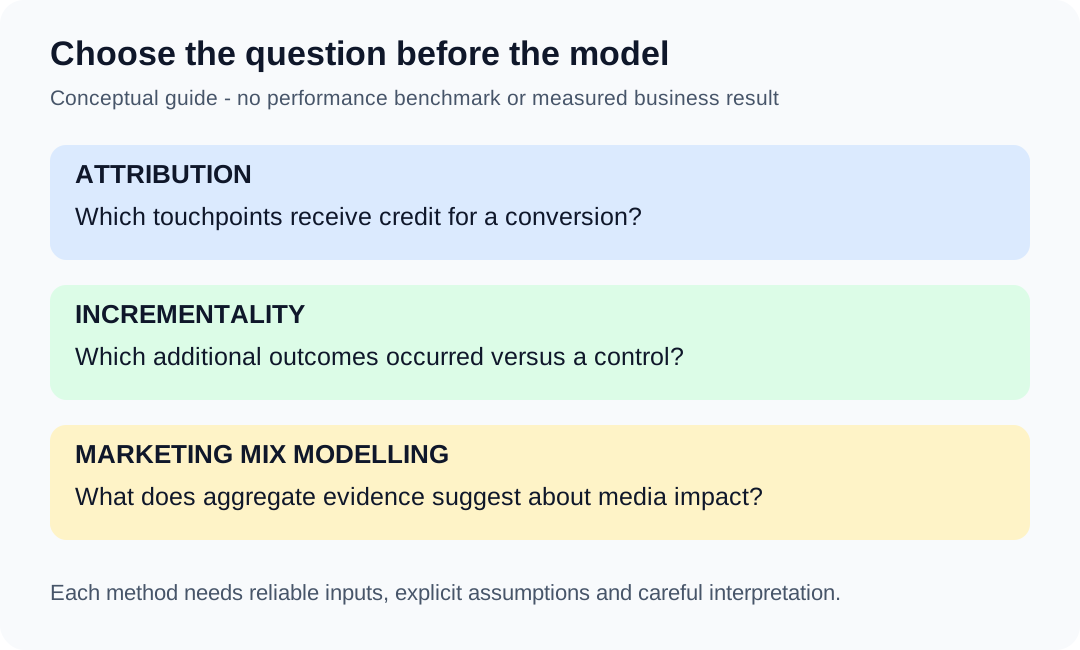
Choose the method to fit the question. Use campaign reports for day-to-day monitoring, experiments for defensible intervention questions, and a properly designed MMM when strategic modelling is justified. Investigate disagreement between methods rather than averaging incompatible numbers into a supposedly definitive ROI.
Useful adjacent tools, without confusing their roles
Reporting and storage: the former Looker Studio URL now redirects to Google's Data Studio page. Its self-service visualisation/reporting tier is listed at no charge. It is useful for assembling a dashboard; a charting layer does not repair mismatched definitions. BigQuery separately charges for compute and storage, with other operations potentially billable. Connectors, transformations and query design affect total cost. Google reporting product, BigQuery pricing
Specialist marketing measurement: Triple Whale, Northbeam and Rockerbox document attribution, MMM and incrementality offerings. They belong on a shortlist when paid-media measurement is the unresolved problem. This guide has not priced or tested them, so it does not award a winner or invent a minimum spend threshold. Request the actual source connections, historical coverage, methodology and quote. Triple Whale, Northbeam, Rockerbox
Collection infrastructure: Twilio Segment and RudderStack belong to the customer-data and pipeline layer. Consider them when consistent collection and delivery across systems is the missing capability. They are additional architecture choices, not automatic substitutes for an attribution model or dashboard. Segment, RudderStack
Behaviour and replay: PostHog is another product-analytics candidate; its published cloud offer includes one million analytics events per month free, with usage pricing beyond allowances. For self-hosting, inspect current component licensing and operational requirements rather than treating a code repository as cost-free managed hosting. Microsoft Clarity documents free session recordings, heatmaps and AI summaries. Session replay can help investigate friction but requires appropriate privacy configuration. PostHog pricing, Clarity
Google Ads and Meta's own measurement should remain part of the review. Their conversion definitions, attribution windows and modelling need reconciliation with CRM or finance outcomes. Adding reported revenue from multiple advertising platforms can double-count a purchase each platform claims.
Consent, signal loss and privacy change the numbers
Start with the processing design: what events are collected, which identifiers they contain, why the data is needed, where it goes and how consent or objections affect that flow. GDPR, local cookie requirements and India's DPDP framework must be assessed in their applicable jurisdiction and stage of commencement; one banner or vendor badge cannot establish universal compliance.
Google distinguishes basic and advanced consent-mode implementations. In basic mode, tags remain blocked until the relevant consent interaction; in advanced mode, tag behaviour can include cookieless pings when storage consent is denied. “Declined cookies” does not therefore describe one identical network outcome across implementations. Consent mode communicates choices; it does not obtain consent on its own. Consent-mode overview
Behavioural modelling also has eligibility requirements. Google explicitly says satisfying its external prerequisites does not guarantee eligibility. Modelled activity is an estimate, not a recovery of each missing person's exact behaviour. Label observed and modelled reporting appropriately. Behavioural modelling
Apple's App Tracking Transparency governs permission for tracking across other companies' apps and websites in relevant circumstances. Those restrictions affect the signals available for advertising measurement; they do not imply that all first-party analytics are identical to cross-company tracking. Apple developer documentation
India's DPDP Rules were notified in November 2025 with phased implementation. Do not claim that every substantive duty was already fully operative on this guide's check date. Review the actual commencement notices and the organisation's responsibilities with qualified advisers. MeitY rules hub, government explanation of phased implementation
Server-side collection changes where requests are processed; it is not permission to bypass user choices. Test accepted, declined and withdrawn-consent paths in the browser and downstream systems. Minimise identifiers and inspect URLs and event properties for accidental personal information. The ICO's anonymisation guidance distinguishes anonymous information from pseudonymous personal data: masking a name alone need not make a record anonymous. ICO guidance
A realistic cost example, without invented ROI
The following is an illustrative planning worksheet, not a vendor quote, measured time-saving result or predicted return. Assume a small team's chosen analytics licence and reporting tier cost $0, while it budgets for a connector, warehouse use and staff work.
| Item | Explicit assumption | First month | Later monthly budget |
|---|---|---|---|
| Analytics and reporting licences | Selected no-charge tiers; required features fit their limits | $0 | $0 |
| Data connector | Hypothetical budget allowance | $30 | $30 |
| Warehouse | Hypothetical compute/storage allowance | $20 | $20 |
| Initial implementation | 12 hours × $40/hour | $480 | $0 |
| Tracking maintenance | 3 hours × $40/hour | $120 | $120 |
| Review and interpretation | 4 hours × $40/hour | $160 | $160 |
| Total | Excludes advertising spend, taxes and other services | $810 | $330 |
The annual planning cost is $4,440: the $480 one-time setup plus twelve months at $330. Actual warehouse and connector costs depend on usage and provider terms. Staff work is valued time, which may differ from incremental cash spending. A paid licence, consent platform, implementation agency or higher data volume would change the example.
Download the assumption worksheet and calculation script. The script verifies the arithmetic; it does not validate the assumptions or demonstrate ROI. To evaluate return, record a specific decision, its implementation cost and an appropriate outcome comparison. More attributed revenue is not automatically more incremental profit.
What AI analytics gets wrong
False anomalies: a spike can result from duplicate events, a release, changed consent collection, a bot or an imported backlog. Inspect those explanations before announcing a customer trend.
Thin or biased history: a model cannot establish reliable predictions simply because the calendar reaches three or six months. Eligibility, representative outcomes, changing product behaviour and stable definitions matter. A historical pattern can favour segments that were previously targeted more heavily.
Correlation presented as cause: customers who use a feature may retain better because they already have stronger intent. A chart showing both facts does not establish that forcing every customer through the feature increases retention.
Wrong denominators and confident prose: an assistant may compare sessions with users, gross revenue with net revenue, or leads with qualified opportunities. Ask it to show the query, filters, time zone and metric definitions. Maintain a human approval step before its output changes budgets or customer treatment.
A 30-day setup and evaluation checklist
This is a proposed work plan, not a promise of results or predictive eligibility within a month. Assign a measurement owner and an engineering owner before beginning.
Days 1–7: define events and consent behaviour
Write one decision the dashboard should support. Define a conversion that represents a meaningful outcome, then distinguish intermediate actions from completed outcomes. Use consistent event names and document required properties, deduplication, ownership and prohibited personal data.
| Example event | Business meaning | Checks before reporting |
|---|---|---|
generate_lead |
A valid submission, not just a button click | Successful response, duplicate handling and exclusion of form text |
purchase |
A completed transaction | Transaction identifier, value, currency and duplicate prevention |
trial_activated |
Your documented activation condition | Stable definition, permitted user linkage and a named owner |
The last event is a proposed custom event, not a claim that every platform supplies it. Test deliberate failures as well as successful actions. Write down what happens when consent is denied or withdrawn; do not leave that to a dashboard assumption.
Days 8–14: reconcile a controlled sample
Create test transactions or submissions in an authorised environment. Compare the records with the corresponding source system. Investigate mismatches individually: currency, time zone, duplicate firing, refunds and qualification rules can all change totals.
Build one initial dashboard showing source, agreed outcome, conversion rate and reconciliation exceptions. Keep a small data-quality panel visible. A reliable alert about broken tracking can be more useful than another recommendation generated from unreliable inputs.
Days 15–21: inspect one analysis and its limitations
Choose a funnel, segment comparison or attribution report and reproduce its logic. Record the model, window, exclusions and missing signals. If predictive audiences are unavailable, document that result rather than creating a fictional prediction screenshot.
Use this review prompt when a tool offers a suitable assistant:
Explain the change in the selected conversion metric for this exact period.
Show the metric definition, denominator, filters and underlying query or report.
Separate observed data from modelled estimates.
Check duplicate events and collection changes before proposing explanations.
List plausible hypotheses, but do not claim a channel caused incremental sales
without a suitable experiment or causal analysis.
Days 22–30: decide whether to keep, change or expand
Record how long setup and recurring checks actually took, which analysis changed a decision, and whether an unresolved data problem prevents reliable use. Compare the resulting cost with the worksheet assumptions. Stop paying for duplicate dashboards that do not serve a distinct question.
For interface practice, Google's demo account provides sample GA4 properties, but demo access is not a test of your implementation or authority to change an organisation's production tracking. This article has not run that exercise and reports no setup timings or firsthand screenshots. Official demo-account guidance
Final buying decisions and further reading
For a small website, begin with GA4's ordinary reporting and an explicit event audit; do not choose it on a promise of immediately available prediction. For a B2B team already depending on HubSpot, compare the precise CRM and attribution entitlements with the full cost. For product-led growth, trial Mixpanel, Amplitude or PostHog against the same activation question. For substantial cross-channel measurement, evaluate specialist methods and an implementation partner where the requirements justify it.
There is no supported universal budget band that makes HubSpot Professional fit under $500/month, or Adobe cost a fixed minimum. Use an actual quote and measured implementation requirements. The best next purchase is the one that closes an identified measurement gap, rather than simply adding an AI label to the stack.
Continue with AI for Data Analysis: a practical guide with prompts and checks and AI Customer Feedback Analysis Tools Compared for related evaluation workflows. Feedback analysis adds useful customer context; it should not be mistaken for causal marketing attribution.
Tags
Written by

Sourabh Gupta
Author at Teach AI Tools
Sourabh Gupta is responsible for Teach AI Tools. Research guides and documented firsthand reviews are identified separately. An author profile is not evidence of testing; look for sources, test records, and limitations in the article.
Full bio & editorial process →