
The Macro "AI Trade": Capital Capex, Debt, and Bubble Debates
Editorial note: Some links in this article are affiliate links — we may earn a commission if you sign up, at no extra cost to you. Research guides are distinguished from documented firsthand reviews in our editorial standards. Read our editorial standards →

FINANCIAL TECHNOLOGY • EDITORIAL ANALYSIS
An institutional evaluation of capital allocation cycles, sovereign credit exposure, debt-financed hyperscaler infrastructure, and systemic risk transmission.
Executive Summary: Global capital markets are navigating one of the most concentrated capital-allocation cycles in economic history. Artificial intelligence has evolved from an experimental software thesis into a capital expenditure supercycle, fundamentally restructuring corporate balance sheets, debt markets, and equity index weightings. As central banks and institutional asset managers warn of valuation compression, structural fault lines are emerging across the AI value chain.
| >$600B | ~40x | -45% |
|---|---|---|
| HYPERSCALER ANNUAL CAPEX | S&P 500 CAPE RATIO | TOKEN INFERENCE COST (QOQ) |
1. ECB & Institutional Valuation Warnings: From Sector Risk to Systemic Variable
In mid-August 2026, the European Central Bank (ECB) published an in-depth valuation analysis examining whether the AI equity boom mirrors historical speculative manias, drawing direct comparisons to the 19th-century railway boom, the 1920s utility expansion, and the late-1990s dot-com bubble. The central bank's core thesis departed from conventional bubble discourse: an asset price correction does not require the underlying technology to fail. Even if generative AI delivers on long-term productivity and macroeconomic gains, equity valuations can suffer severe repricing.
Historical infrastructure buildouts provide a cautionary blueprint. During the British railway mania of the 1840s and the American fiber-optic buildout of the late 1990s, the physical networks installed transformed global commerce over multi-decade horizons. However, early equity investors and heavily leveraged corporate sponsors were largely wiped out during the intermediate digestion phase when immediate capacity outstripped near-term cash flow realization. The ECB warns that capital markets are exhibiting similar structural vulnerabilities today.
Mechanism of Systemic AI Risk Transmission
The structural mechanics outlined by central banks and institutional economists emphasize three core vulnerabilities:
- Equity Risk Premium (ERP) Expansion: During the early adoption phase (2023–2025), AI risks were confined to high-performing mega-cap technology leaders—the "Magnificent Seven". As enterprises across healthcare, financial services, logistics, and manufacturing pour billions into high-performance computing (HPC) contracts and proprietary model pipelines, AI is transforming into an economy-wide structural variable. When an entire corporate ecosystem becomes tied to the ROI of an emerging technology, investors demand a higher baseline Equity Risk Premium (ERP), compressing price-to-earnings multiples across the broader market.
- Elevated Cyclically Adjusted Valuations: Valuation metrics across US equities remain near historic extremes. The Cyclically Adjusted Price-to-Earnings (CAPE) ratio for the S&P 500 hovered near 40x—an earnings yield of just 2.5%. This leaves zero margin of safety for operational hiccups, delays in model monetization, or power-grid bottlenecks.
- Cross-Border Contagion and Wealth Destruction: The ECB explicitly highlighted cross-border balance sheet vulnerability. Euro-area households and institutions hold over €440 billion ($510 billion) in direct and indirect exposure to US mega-cap technology stocks via ETFs, mutual funds, and pension allocations. A sell-off originating on Wall Street would transmit immediate financial instability to European credit markets, consumer confidence, and corporate balance sheets.
2. Debt Financing and Circular Capital Vulnerabilities
The balance sheets underpinning the AI expansion are undergoing a fundamental structural transition. The initial infrastructure buildout (2023–2024) was funded almost exclusively through the massive free cash flow reserves of dominant, cash-rich tech balance sheets. By late 2026, however, the financial architecture behind AI infrastructure mirrors an aggressive leveraged capital expenditure cycle.
Financial reviews, including 360 ONE Asset's August 2026 market panorama and debt-rating analyses, highlight several structural fault lines running through the AI value chain:
Figure 1: Hyperscaler Capital Intensity Surge vs. the CapEx-to-Revenue Monetization Reality Gap ($B)
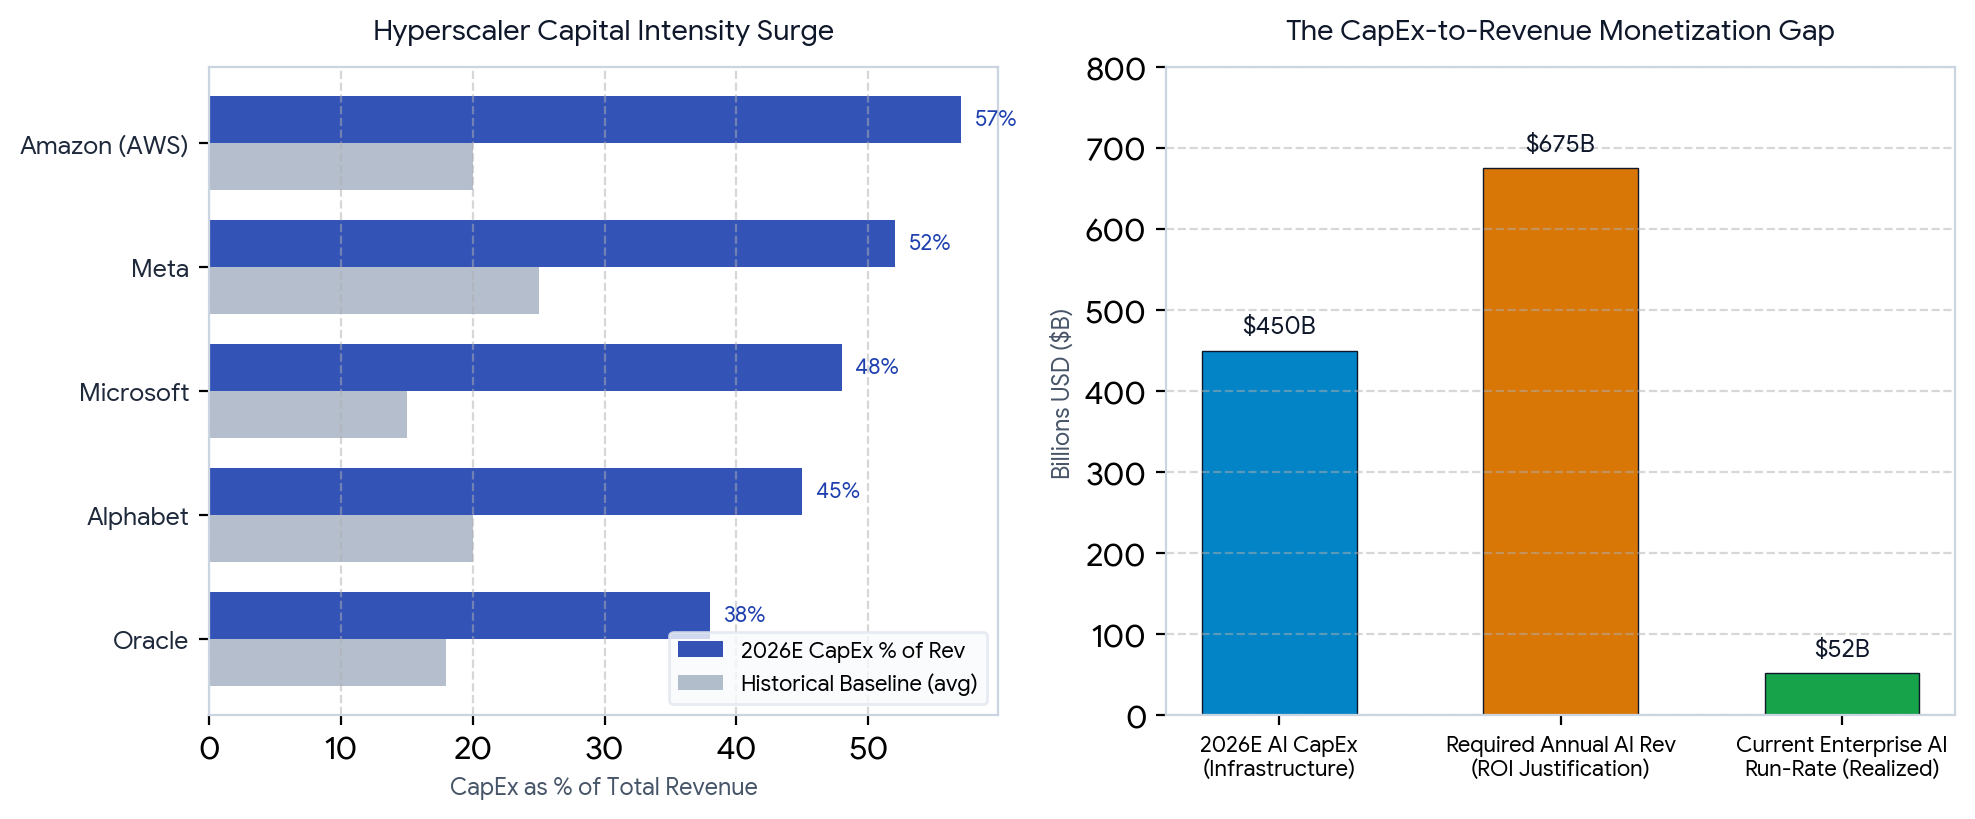
Figure 1 in the source report compares hyperscaler capital intensity with the revenue required to justify the infrastructure cycle. The chart shows capital intensity of 57% for Amazon (AWS), 52% for Meta, 48% for Microsoft, 45% for Alphabet, and 36% for Oracle; and compares 2026 AI CapEx ($450B), required annual AI revenue ($675B), and current realized enterprise AI run-rate ($52B).
The Debt Wave and Historic Capital Intensity
Annual capital expenditure across the "Big Five" hyperscalers (Amazon, Microsoft, Alphabet, Meta, and Oracle) has surged past $600 billion, marking a 36% year-over-year jump. Approximately $450 billion of this total is directed strictly into compute infrastructure, custom silicon, high-bandwidth memory, and liquid-cooled data centers.
Hyperscaler capital intensity (CapEx as a percentage of revenue) has reached between 45% and 57%—levels historically associated with heavy capital-intensive utility or semiconductor foundry sectors rather than high-margin software platforms (historical software norms ranged from 15% to 25%). Tech giants raised over $108 billion in debt in 2025 alone and are projected to issue over $1.5 trillion in long-term debt through the late 2020s to fund continuous multi-gigawatt power and cluster deployments.
Circular Financing Dynamics: A persistent structural risk within private markets is the prevalence of circular financing loops. Leading hyperscalers invest billions in venture-backed frontier AI labs; those startups subsequently return that same capital to the parent cloud provider in the form of guaranteed multi-year compute commitments. While this structure accelerates R&D and secures early GPU clusters, it synthetically inflates top-line cloud growth metrics. If venture funding cools or startup cash-burn outpaces organic enterprise billing, these cloud commitments risk severe write-downs, revealing underlying revenue fragility.
Figure 2: API Token Inference Deflation Index vs. Regional Macro Contagion Sensitivity
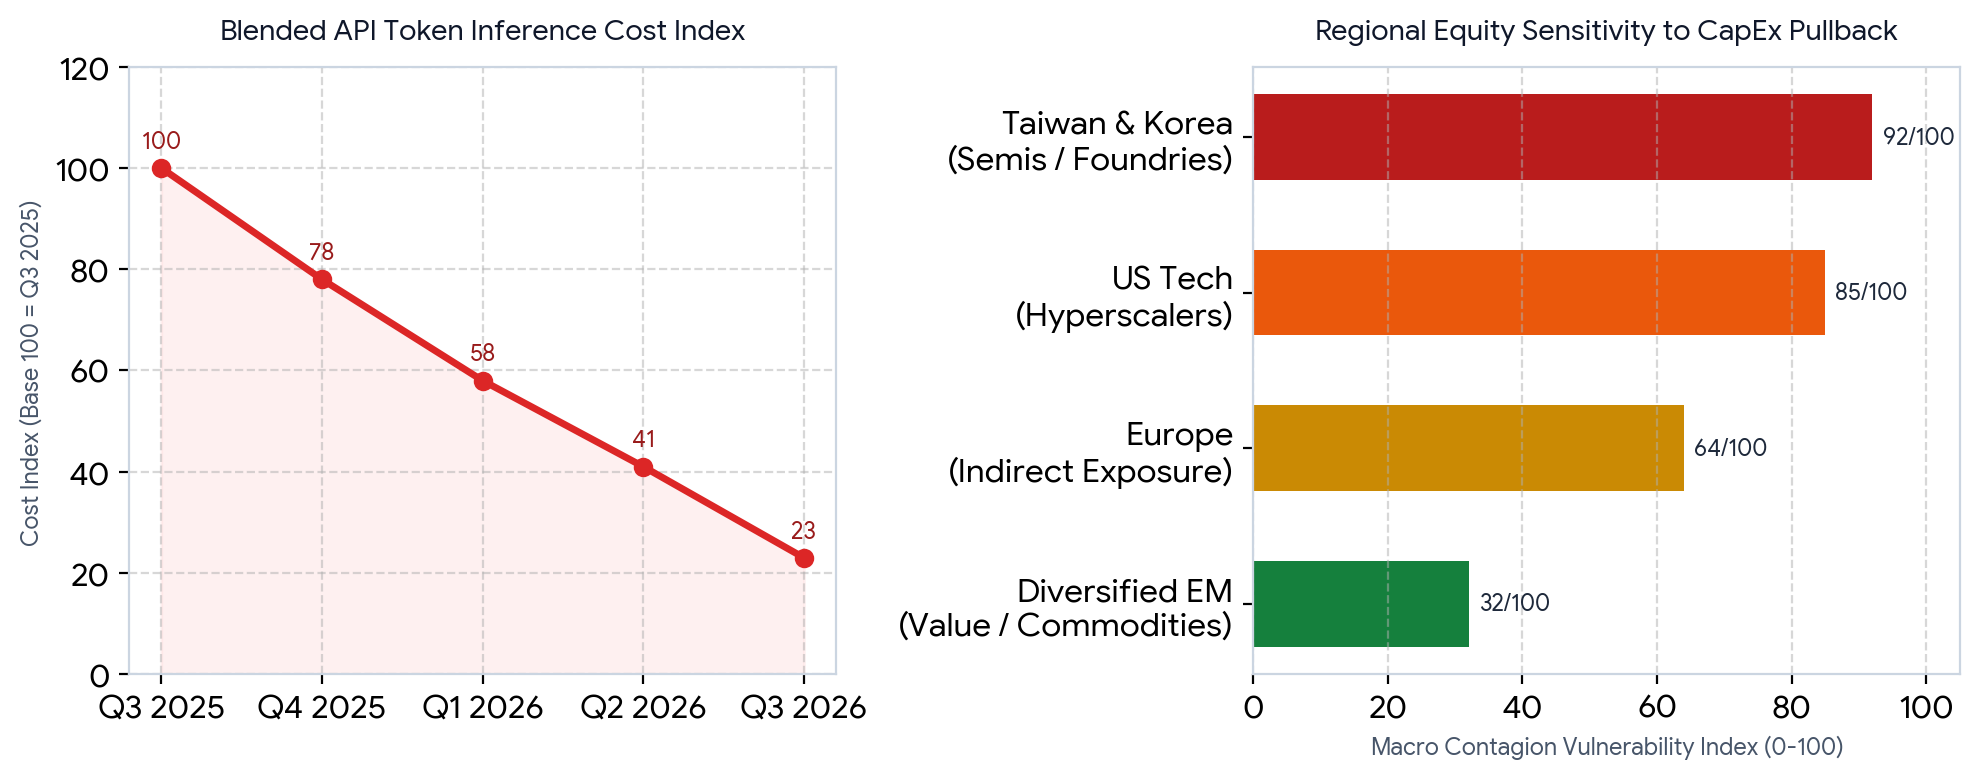
Figure 2 in the source report shows blended token inference costs falling from an index of 100 in Q3 2025 to 23 in Q3 2026, alongside macro contagion sensitivity scores of 92/100 for Taiwan & Korea, 85/100 for US Tech, 64/100 for Europe, and 32/100 for Diversified EM.
The Inference Price War and Token Deflation
The economic model of AI software faces severe deflationary headwinds. Blended API token inference costs have plummeted roughly 45% quarter-over-quarter. The rapid proliferation of highly efficient open-weight models, coupled with breakthroughs in quantization, speculative decoding, and model distillation, has commoditized raw text and code generation.
As open-weight architectures rival proprietary frontier models at a fraction of the operating cost, downstream software developers cannot maintain premium pricing tiers. The investment dynamic is rapidly pivoting away from speculative frontier model hype toward low-margin, cost-effective execution, squeezing intermediate software gross margins.
3. Market Concentration vs. Contagion Risks
Equity market concentration has reached levels not witnessed since the 1920s or the peak of the Nifty Fifty era. Global stock indices are heavily weighted toward a narrow corridor of semiconductor designers, foundry operators, and cloud infrastructure monopolies. Tech-heavy indices remain exceptionally sensitive to hardware order book adjustments and capex decelerations.
| Region / Index | Primary Exposure Channel | Vulnerability Profile | Contagion Risk |
|---|---|---|---|
| US Tech Indices (Nasdaq, S&P 500) | Hyperscalers, GPU designers, EDA & cloud software | High CAPE ratios (~40x); heavy exposure to corporate CapEx momentum | High |
| Taiwan & South Korea (TSMC, SK Hynix, Samsung) | Advanced node fabrication, CoWoS packaging, HBM3e/HBM4 memory | Hardware supply chain bottlenecks; margin risk on any CapEx pause | Extreme |
| European Markets (Euro Stoxx, DAX, CAC) | Equipment (ASML), energy/industrial suppliers (Schneider, Siemens) | Moderate direct tech exposure, but heavy indirect portfolio asset exposure | Moderate-High |
| Diversified EM (LatAm, India, ASEAN) | Commodities, financials, manufacturing, consumer staples | Low direct exposure to AI silicon; risk-off capital flight exposure | Low-Moderate |
Supply Chain Vulnerabilities in Tech-Heavy Indices
Markets like South Korea and Taiwan are tightly coupled to upstream semiconductor capital cycles. Because memory manufacturers (SK Hynix, Samsung) and packaging foundries (TSMC) operate massive multi-year fixed-cost facilities, any quarterly capex deceleration from the top five US hyperscalers directly compresses operating margins and ripples across their sovereign equity indices.
The Asymmetry of Modern Contagion
Unlike the dot-com bust of 2000–2002—where unprofitable startups with no clear business models went bankrupt—the modern AI trade is anchored by some of the most profitable, cash-generative corporations in human history. However, the systemic threat stems from the sheer scale of investment relative to macro liquidity.
If global capex cycles slow while debt servicing costs remain elevated due to sticky interest rates, the repricing of tech equities will trigger broader portfolio rebalancing across institutional asset managers. Pension funds and sovereign wealth funds holding passive index trackers will experience simultaneous drawdowns in their core equity allocations, forcing liquidity preservation strategies that restrict credit to traditional sectors.
4. The Path Forward: Paradigm Shift or Capital Destruction?
The macro AI trade stands at an inflection point. The debate is no longer about whether artificial intelligence is a legitimate general-purpose technology—its capabilities in automating knowledge work, code generation, and enterprise workflows are well established. The question is whether public equity and corporate debt markets have front-run the monetization timeline by a decade.
The CapEx-to-Revenue Reality Gap:
• Expected 2026 AI CapEx: ~$450 Billion • Required Annualized End-User AI Revenue: ~$600–$750 Billion (to justify capital cost) • Current Realized Enterprise AI Software Run-Rate: ~$40–$60 Billion
Conclusion: The gap requires massive downstream productivity gains to bridge the valuation divide.
For institutional investors, hedge funds, and corporate treasuries navigating 2026 and beyond, three structural indicators will determine whether the market experiences an orderly digestion or an aggressive repricing:
- Enterprise Revenue Velocity vs. CapEx Growth: Whether non-tech enterprises can convert pilot workflows into measurable top-line margin expansion rather than pure operational overhead.
- Free Cash Flow Conversion Amid Rising Debt: Whether hyperscalers can sustain $100B+ individual annual budgets without degrading credit ratings or requiring expensive debt refinancing.
- Model Efficiency vs. Silicon Demand: If algorithmic breakthroughs continue to reduce the compute needed to train and run high-performing models, hardware demand may peak earlier than current multi-year order books anticipate.
Tags
Written by

Sourabh Gupta
Author at Teach AI Tools
Sourabh Gupta is responsible for Teach AI Tools. Research guides and documented firsthand reviews are identified separately. An author profile is not evidence of testing; look for sources, test records, and limitations in the article.
Full bio & editorial process →